Tracking Essential Metrics for PHP Production Performance
Track Response Time, Memory Usage, SQL Query Count, and CPU Load. Learn which numbers actually matter when your app feels "sluggish."
Most PHP applications start their life very fast. Pages load quickly. APIs respond instantly. Everything feels smooth.
Then the application goes live. Real users come in. Database grows. Traffic increases. Slowly, small problems start showing up.
One page takes 2 seconds instead of 200ms. A report page starts timing out. CPU usage goes high without any clear reason.
This is where performance metrics matter. Without proper metrics, you are just guessing. With metrics, you know exactly where the problem is.
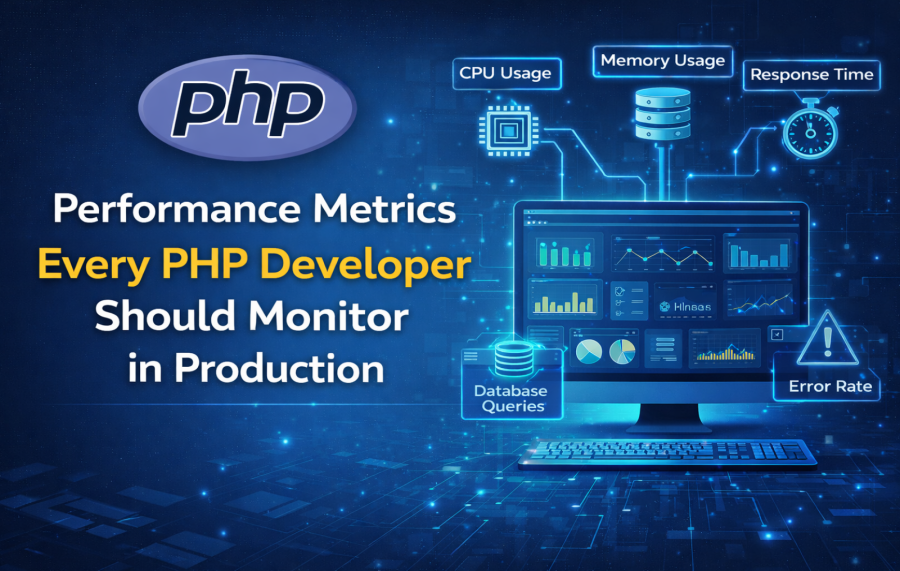
In this post, we will discuss the most important performance metrics every PHP developer should monitor in production. No fancy theory. Only real-world experience.
Why Monitoring Performance Metrics in Production Is Not Optional Anymore
Many developers rely on local testing. If the code works fast on localhost, they assume it will work fast in production.
This assumption is dangerous. Production is a completely different world.
In production:
- Multiple users hit the app at the same time
- Database size grows every day
- Background jobs run continuously
- Third-party APIs respond slowly sometimes
Without monitoring, performance problems grow silently. You only notice them when users complain or revenue drops.
Monitoring metrics helps you:
- Detect problems early
- Fix issues before users feel them
- Understand real usage patterns
- Make confident performance decisions
Production vs Local Environment – Why Performance Behaves Differently
Local environment is clean and simple. Production is messy and unpredictable.
On localhost:
- Single user
- Small database
- No network latency
- No traffic spikes
In production:
- Hundreds or thousands of users
- Large tables with millions of rows
- Network delays
- CPU and memory shared with other processes
This is why code that looks fine locally can struggle badly in production. Metrics show you this reality clearly. If you've ever faced this situation, you should read why your PHP app is fast on localhost but slow on a live server and how to fix it.
Key Categories of PHP Performance Metrics You Must Track
To understand performance fully, metrics should be grouped. Looking at only one type of metric gives a false picture.
Main categories:
- Application-level metrics
- Server and resource metrics
- Database metrics
- User experience metrics
Now let us go through each important metric one by one.
Request Response Time – The First Metric Users Feel
Response time is the most visible metric. Users feel it immediately.
Many teams only look at average response time. This is a mistake.
Why? Because averages hide slow requests.
You should look at:
- Average response time – shows overall speed
- 95% response time – shows how fast the site feels for most users
- 99% response time – shows how bad it gets for a few unlucky users
Example:
Average response time is 300ms. But 5% of requests take 3 seconds.
Those 5% users think your site is slow. Metrics help you find those slow endpoints.
PHP Memory Usage – The Silent Performance Killer
Memory problems rarely fail immediately. They grow slowly.
Common issues:
- Large arrays kept in memory
- Memory leaks in long-running scripts
- Workers not releasing memory
Many developers fix memory issues by increasing memory_limit. This only hides the problem.
You should monitor:
- Memory usage per request
- Memory growth over time
- Memory usage of background jobs
Stable memory usage means stable performance.
CPU Utilization – When PHP Starts Fighting for Resources
High CPU usage means your server is working too hard.
Common PHP causes:
- Heavy loops
- Complex regex patterns
- Inefficient data processing
CPU spikes during traffic bursts are normal. Constant high CPU is not.
Track:
- CPU usage trends
- CPU usage during peak hours
This helps you decide whether to optimize code or scale infrastructure.
Database Query Performance – Where Most PHP Apps Slow Down
In real projects, database is usually the bottleneck.
Common problems:
- Slow queries
- N+1 query issues
- Missing indexes
- Growing tables
You should monitor:
- Slow query logs
- Query execution time
- Queries per request
Optimizing one slow query can improve the entire application.
- Choosing the Right MySQL Data Types: A Hidden Key to Database Performance
- Using EXPLAIN in MySQL to Fix Slow Queries (Practical Guide for Developers)
- How Missing Indexes Kill MySQL Performance
- MySQL JOIN Performance: Common Mistakes in Real Applications
- Common MySQL Indexing Mistakes That Hurt Performance
Error Rate & Warning Frequency
Errors are not just functional problems. They affect performance too.
Repeated warnings and notices slow execution.
Monitor:
- PHP warnings and notices
- Unhandled exceptions
- Failed database connections
A clean error log usually means a healthier system.
External Service & API Latency
Modern PHP apps depend on many external services.
Examples:
- Payment gateways
- Email providers
- SMS services
If an external API is slow, your page becomes slow.
Track:
- API response time
- Timeout frequency
This helps you add timeouts, retries, or async processing.
Cache Hit Ratio – The Difference Between Fast and Very Fast
Caching saves time and resources. But only if it works properly.
Low cache hit ratio means:
- Cache is not configured well
- Data is invalidated too often
Monitor:
- Cache hit vs miss rate
- Cache eviction frequency
Good caching reduces database load and speeds up responses.
Queue & Background Job Performance Metrics
Queues handle heavy work outside user requests.
But slow queues create hidden problems.
Monitor:
- Job execution time
- Failed job count
- Queue backlog size
A growing backlog means your system cannot keep up.
Traffic Patterns & Concurrency
Performance is not linear.
10 users do not behave like 100 users.
Monitor:
- Requests per second
- Peak traffic hours
- Concurrent connections
This helps you plan scaling and optimization.
How to Decide Which Metrics Matter for Your PHP Application
Not all metrics matter equally.
For example:
- Content sites focus on response time
- SaaS apps focus on API latency
- eCommerce sites focus on checkout performance
Choose metrics based on business impact.
Common Mistakes PHP Developers Make While Monitoring Performance
Some common mistakes:
- Monitoring too many metrics
- Ignoring trends
- Only checking metrics when things break
Monitoring should be continuous, not reactive.
Final Checklist – PHP Production Metrics You Should Review Weekly
- Response time (avg, P95)
- Memory usage
- CPU usage
- Slow queries
- Error rates
- Cache hit ratio
Regular review keeps your PHP application fast and stable.
Good performance is not luck. It is monitoring, understanding, and fixing small issues early.

Ketan Patel
PHP & MySQL Performance Optimization Specialist
I specialize in diagnosing and fixing slow PHP applications, optimizing MySQL queries, and resolving backend bottlenecks in live production systems. My approach is metric-driven — identifying root causes through profiling, execution analysis, and structured optimization instead of guesswork.